The goal of this study is to shed light on what is happening in the architectural community for the Pittsburgh region. In addition to looking at compensation it also includes demographics, equity, culture, and licensure. It was inspired by the AIA Compensation Reports (2017 & 2019), Equity By Design (2018 Survey), and Girl Uninterrupted Project (2019). This survey and report was solely provided and analyzed by the owner of mentorArchitect blog, Katelyn Rossier.
Due to limited resources and time to analyze such a report, it does not have the level of detail of the Equity By Design reports; or an interactive data visualization tool as seen in the Girl Uninterrupted Project. If there are specific comparisons covered in this report that you would like to see, let us know for version 2.0 by leaving a comment below.
We hope that each of you take the time to read through this blog post as well as the full Pittsburgh Equity in Architecture Community Report.
General Information
The survey itself was launched through the “Pittsburgh Community Survey Launch” blog post on October 18, 2019. This post was distributed via email, LinkedIn, mentorArchitect Facebook group, YAF Pittsburgh Facebook group, Women+ In Design Pittsburgh Facebook group, YAF Pittsburgh Newsletter, Pittsburgh Women+ In Design Newsletter, and a table at the NOMA Equity Panel Discussion at GBBN’s Pittsburgh office.
I wanted to take a moment to thank everyone that helped spread the word to others in the community. Without your help, we would not have such a high level of participation. And a special thank you to my colleague Kara Berteotti who provided valuable opinions during the creation of the survey and this report. She also generated the education infographic for the report.
After being live for four weeks, the survey closed November 15, 2019 at midnight. In the end we had 160 participants take the survey, and all within the tri-state region. Included in the introduction of the report is the list of survey questions asked. Not every question was analyzed and some were used to ensure that participants are from the Pittsburgh Region.
Below is a comparison of the participation count of this survey in relationship to other architectural surveys nationwide.
Pittsburgh Equity in Architecture Survey : 160
AIA Compensation Report 2017 (Pgh city) : 125
AIA Compensation Report 2017 (Pgh Metro) : 187
AIA Compensation Report 2019 (Pgh) : 109
Girls Uninterrupted Project (2019) : 1,180 total
Boston : 487
New York City : 195
Los Angeles : 132
Washington DC : 168
Chicago : 198
Equity By Design : 14,360
An important point to emphasize is that all the surveys above are only as good as the information gathered. Meaning a survey is only good IF there are participants that take the surveys. If surveys come across your email, please take a few minutes to take the survey before you forget, and do not forget to spread the word. Also take note that we had more participation than the city of Los Angeles from the Girls uninterrupted Project, the AIA Compensation Report 2017 (pgh city), and the AIA Compensation Report 2019 (pgh). The National AIA compensation reports are only useful if there are participants taking the surveys. Let’s make it a goal for our region for the AIA Compensation Report 2021 to have more than double the participation than this survey, so over 320 participants. That means individuals need to not only TAKE the survey but also SHARE the importance of it with their office and/or colleagues in the area.
As you review the results of this survey we do note if there was no data collected (aka no participant for that area), and if there is just a single participant. There are also areas where both genders were not represented within a particular years of experience, so for example, the gender wage gap could not be calculated for that range of years of experience. Other areas we had to remove a participant’s response, for example putting in an obvious fake salary number. (any responses less than 10,000 or over 300,000) To ensure the low and median ranges were not skewed by outliers.
The data being analyzed is also limited at looking at years of experience and job title name. There was not a question to determine salaries based on an individual’s actual roles and responsibilities within a company. These reusults are best used as a starting point when evaluating your own career, or starting a conversation with your office. Understand there are a multitude of factors when determining the compensation of an employee. This survey also identifies that companies do provide a breath of benefits on top of the salary compensation. We recommend that each person should look at their compensation or an offer as a FULL package of compensation, time, and benefits.
Sneak Peak
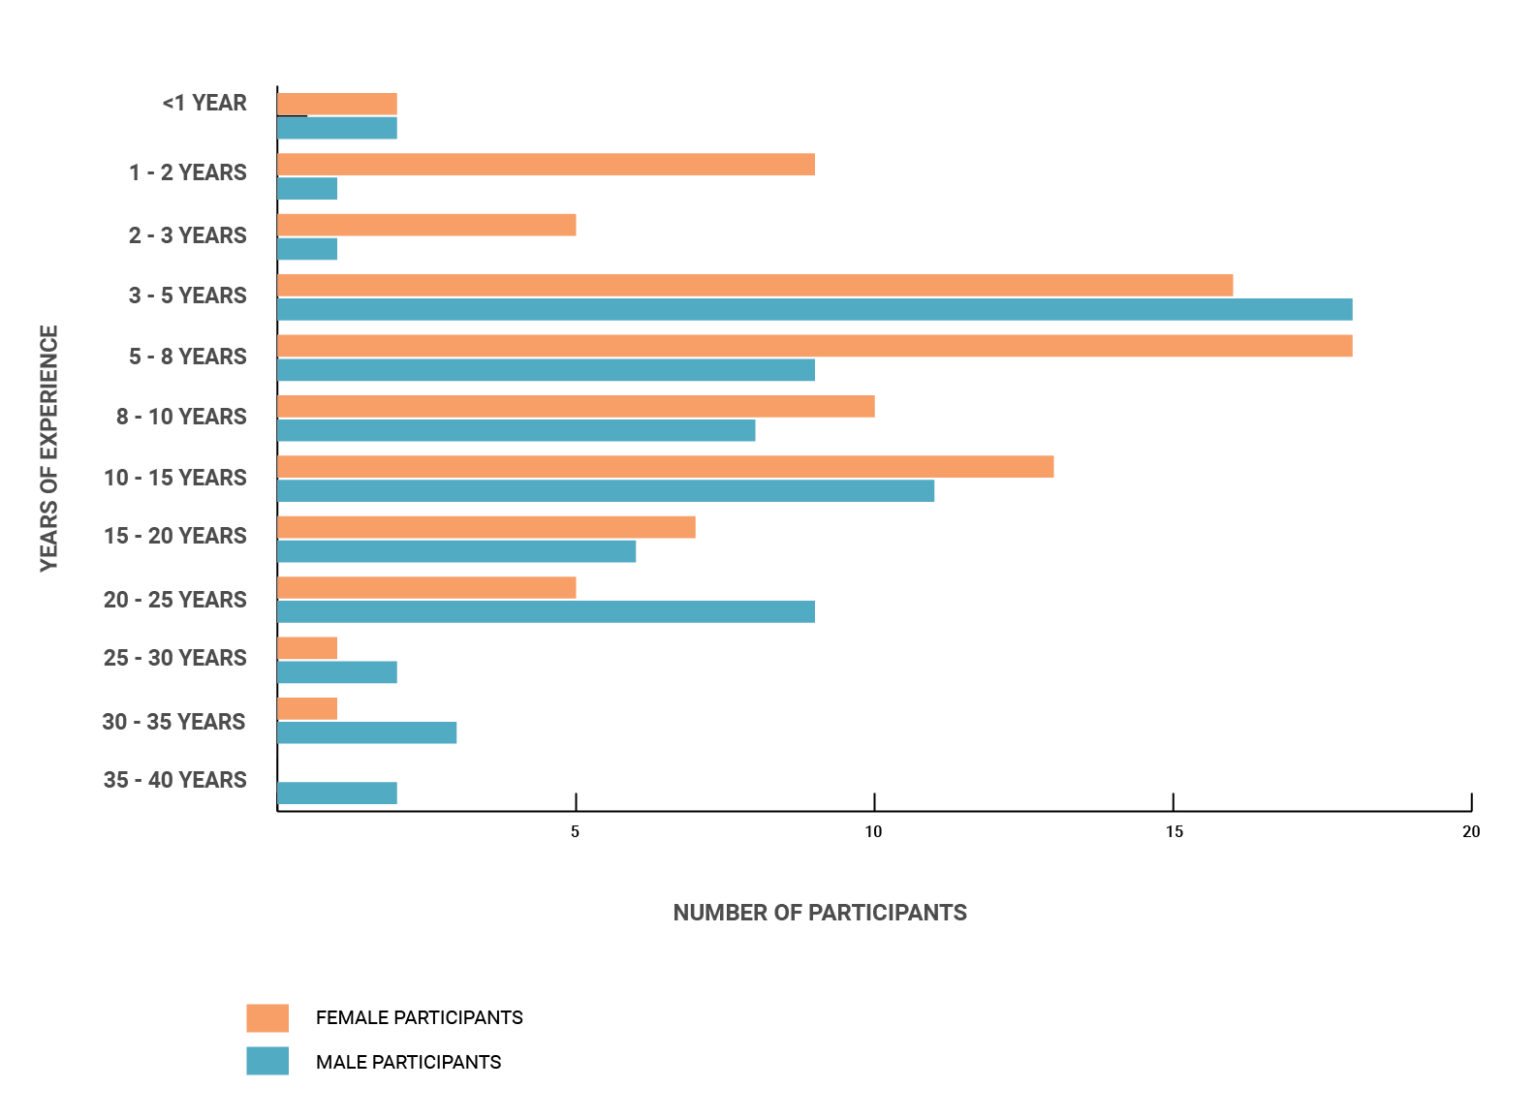
Below is a chart from the survey report that shows the breakdown of participation by gender in relation to years of experience. Certain age ranges had more participation than others. Which impacts the data that could be compared throughout the report. We highlight areas in the report where there was no participant or only one participant.
Next Steps!
Use the information provided in this report, and analyze your own situation. Has your perception of your full compensation package changed since BEFORE you read through this survey report? Determine what you feel is important as part of your career then focus on building value n those areas. Everyone will prioritize different variables when considering employment satisfaction.
Start a discussion with your office about the findings. Having more open conversations allows for greater transparency and the ability to have potentially uncomfortable discussions with more ease. If more people choose to discuss different aspects of the office, how might this improve the work environment?
Be prepared to act. The next time the AIA Compensation Survey emails go around, take a the time to provide this valuable information. This is about making a difference for our community by spending a few minutes occasionally providing feedback or information. After completing the survey, take the next step and share it with others. It takes very little time to forward along to your colleagues and friends, but spreading the word can have a significant impact. This survey alone is proof of the impact that can happen when people share a survey with others. The more people who choose to act, the greater potential improvement in the work environment of the Architectural Community.
If there are specific comparisons NOT covered in this report or different types of questions you would like to see for version 2.0, please let us know by leaving a comment below or connect with Katelyn Rossier on LinkedIn to leave a private message. Leave a comment below on your thoughts of the survey. Did it create a discussion in your office? Was there any particular data you found interesting? Leave a comment below.
Written & report created by Katelyn Rossier
AIA Compensation Survey Salary Calculator
Please note you can go to the AIA Pittsburgh Office to see the Mid Atlantic Report.
AIA Definition of Architectural Positions
SAAM Architecture Employee Handbook
Women at Work Podcast by Harvard Business Review